From an anomaly in the network to a single measurement: analyze noise, vibration, climate and operating data in the right context - and check what your measures achieve.
Locate strong vibrations and mechanical shocks. Compare measurements by speed and direction of travel and narrow down conspicuous sections.
Where do vibrations concentrate?
Find loud events, listen to the audio and examine spectrograms. Trace reports from operations by location and time.
When and where does it get particularly loud?
Compare before and after, for example for lubrication, wheelset changes or rail repairs. Assess changes under comparable operating conditions.
What did the measure change?
View noise and vibration together with temperature and humidity. Investigate possible influencing factors for seasonal anomalies.
What role do climate and speed play?
Narrow down recurring events by location, frequency and intensity. Identify relevant locations for further inspection by your specialists.
Which location should we inspect first?
Compare components, settings and operating conditions. Document results and export selected raw data for in-depth analysis.
Which variant shows which behavior?
From the big picture to the relevant measurement.
Filter by time, measurement module, geographic position and measured values. Combine criteria for your specific question.
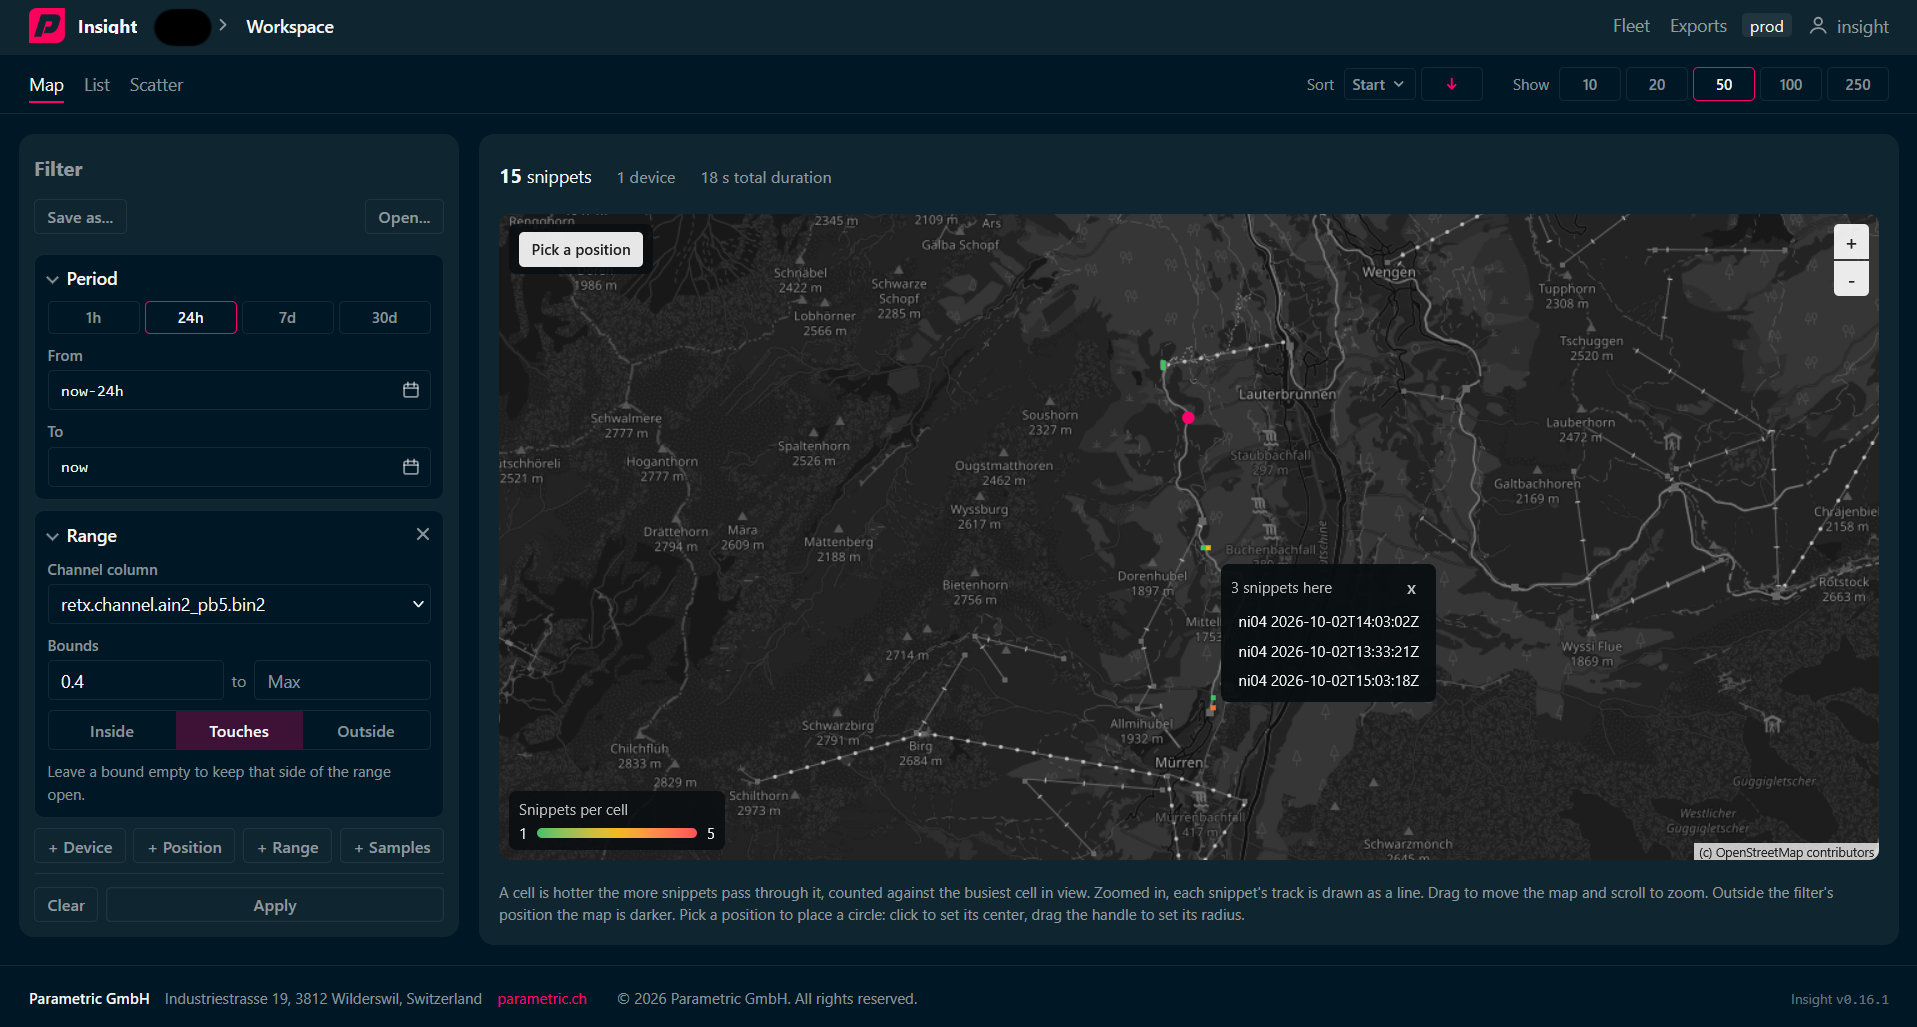
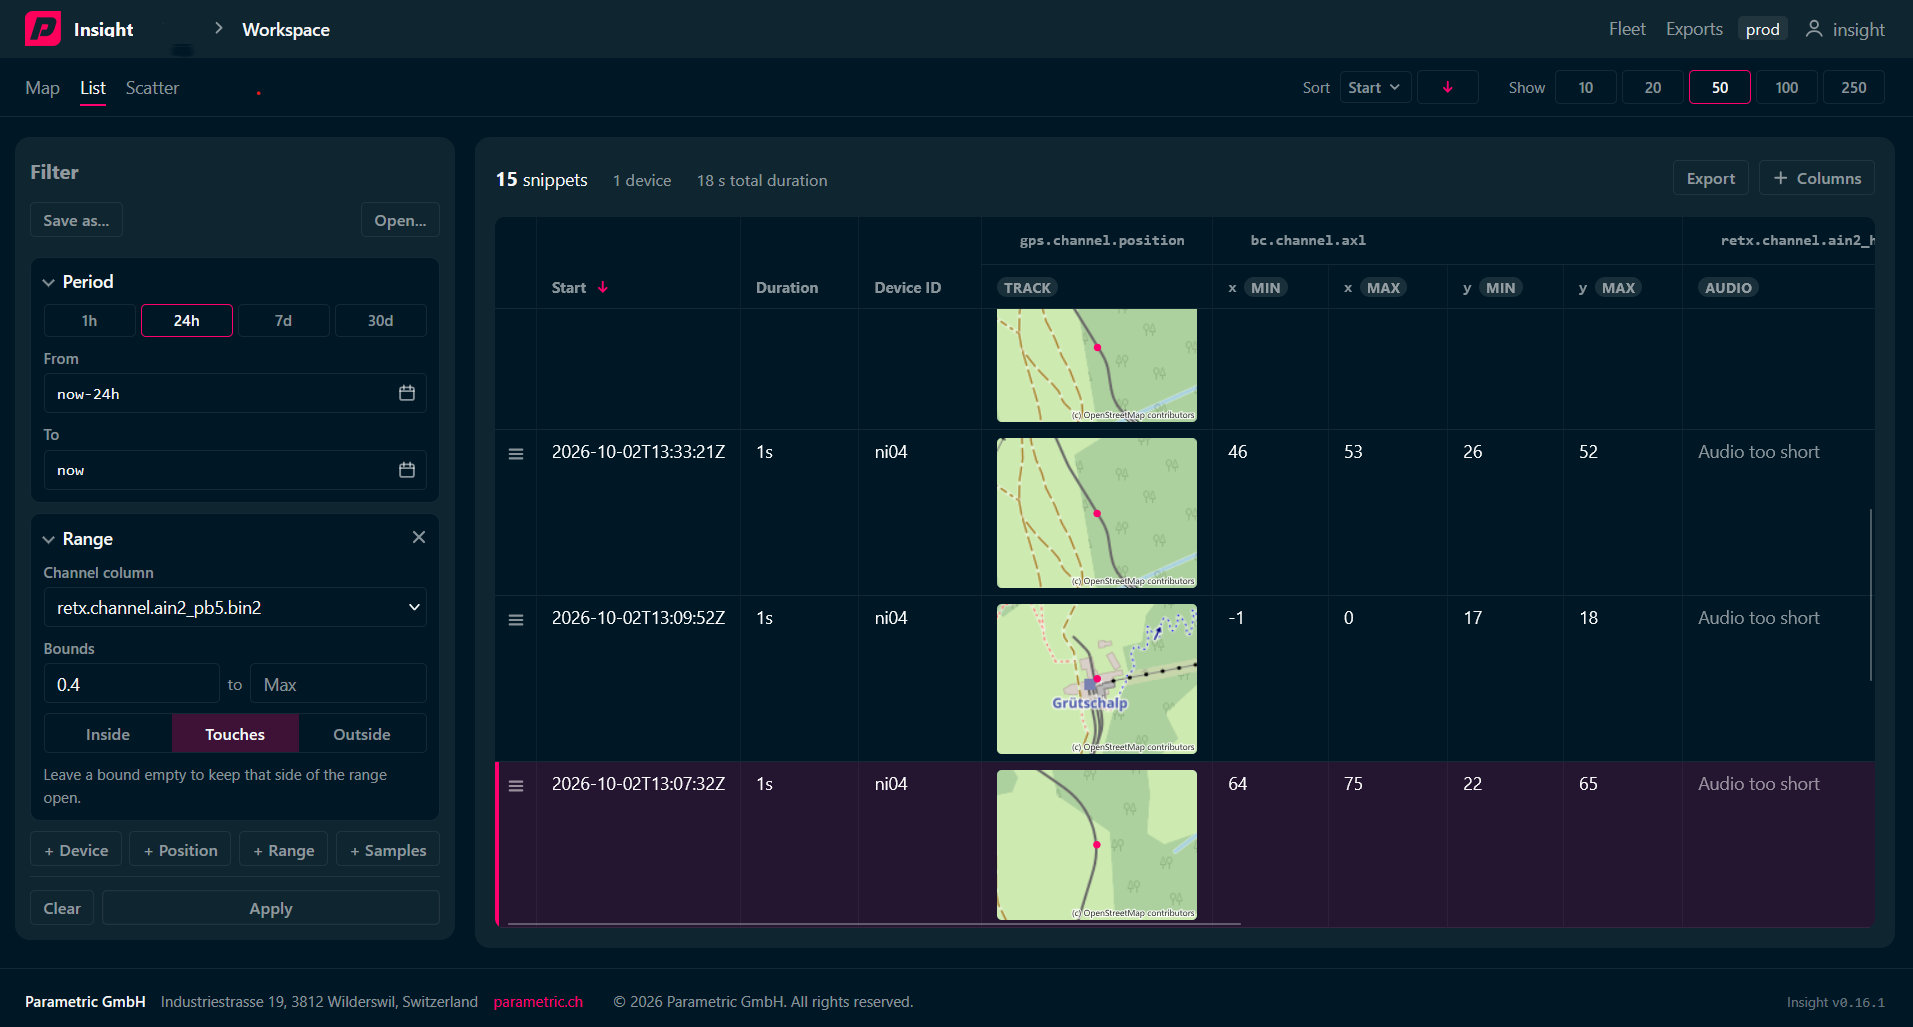
Switch between map, list and scatter plot. Find conspicuous measurements, open them and view them in full context.
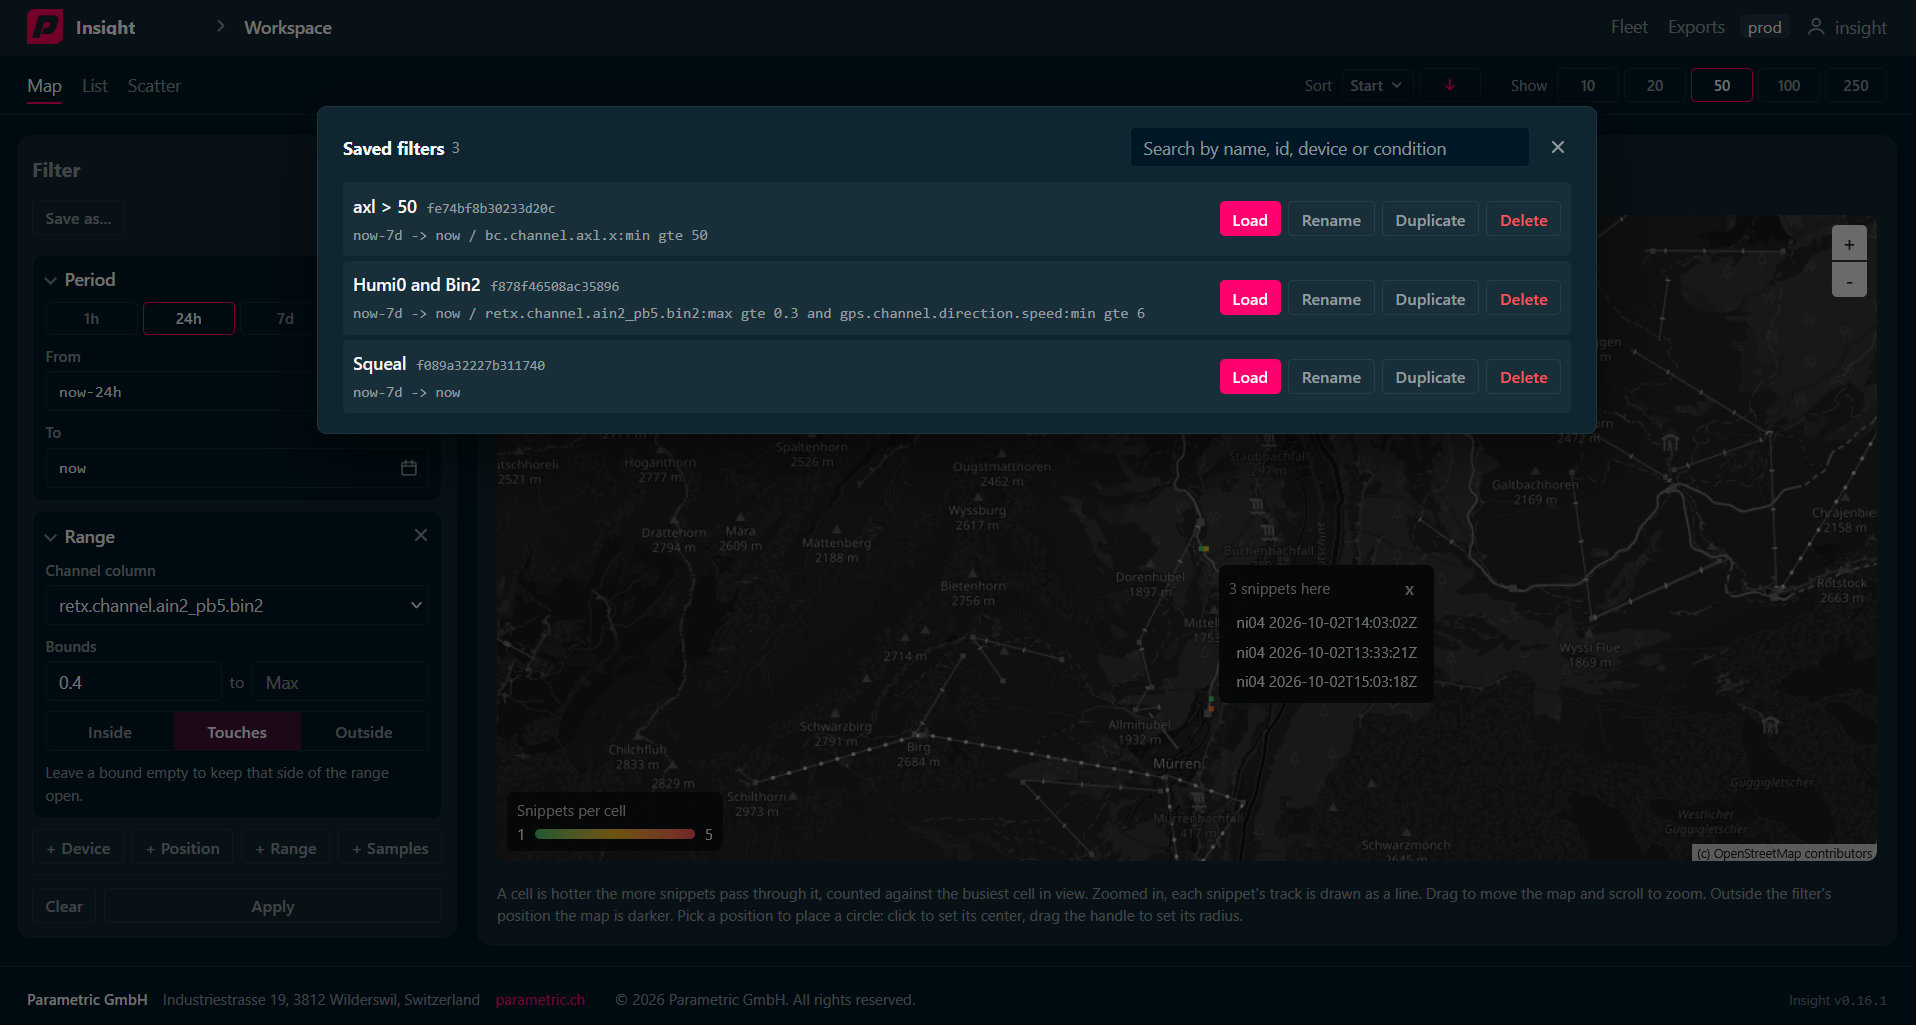
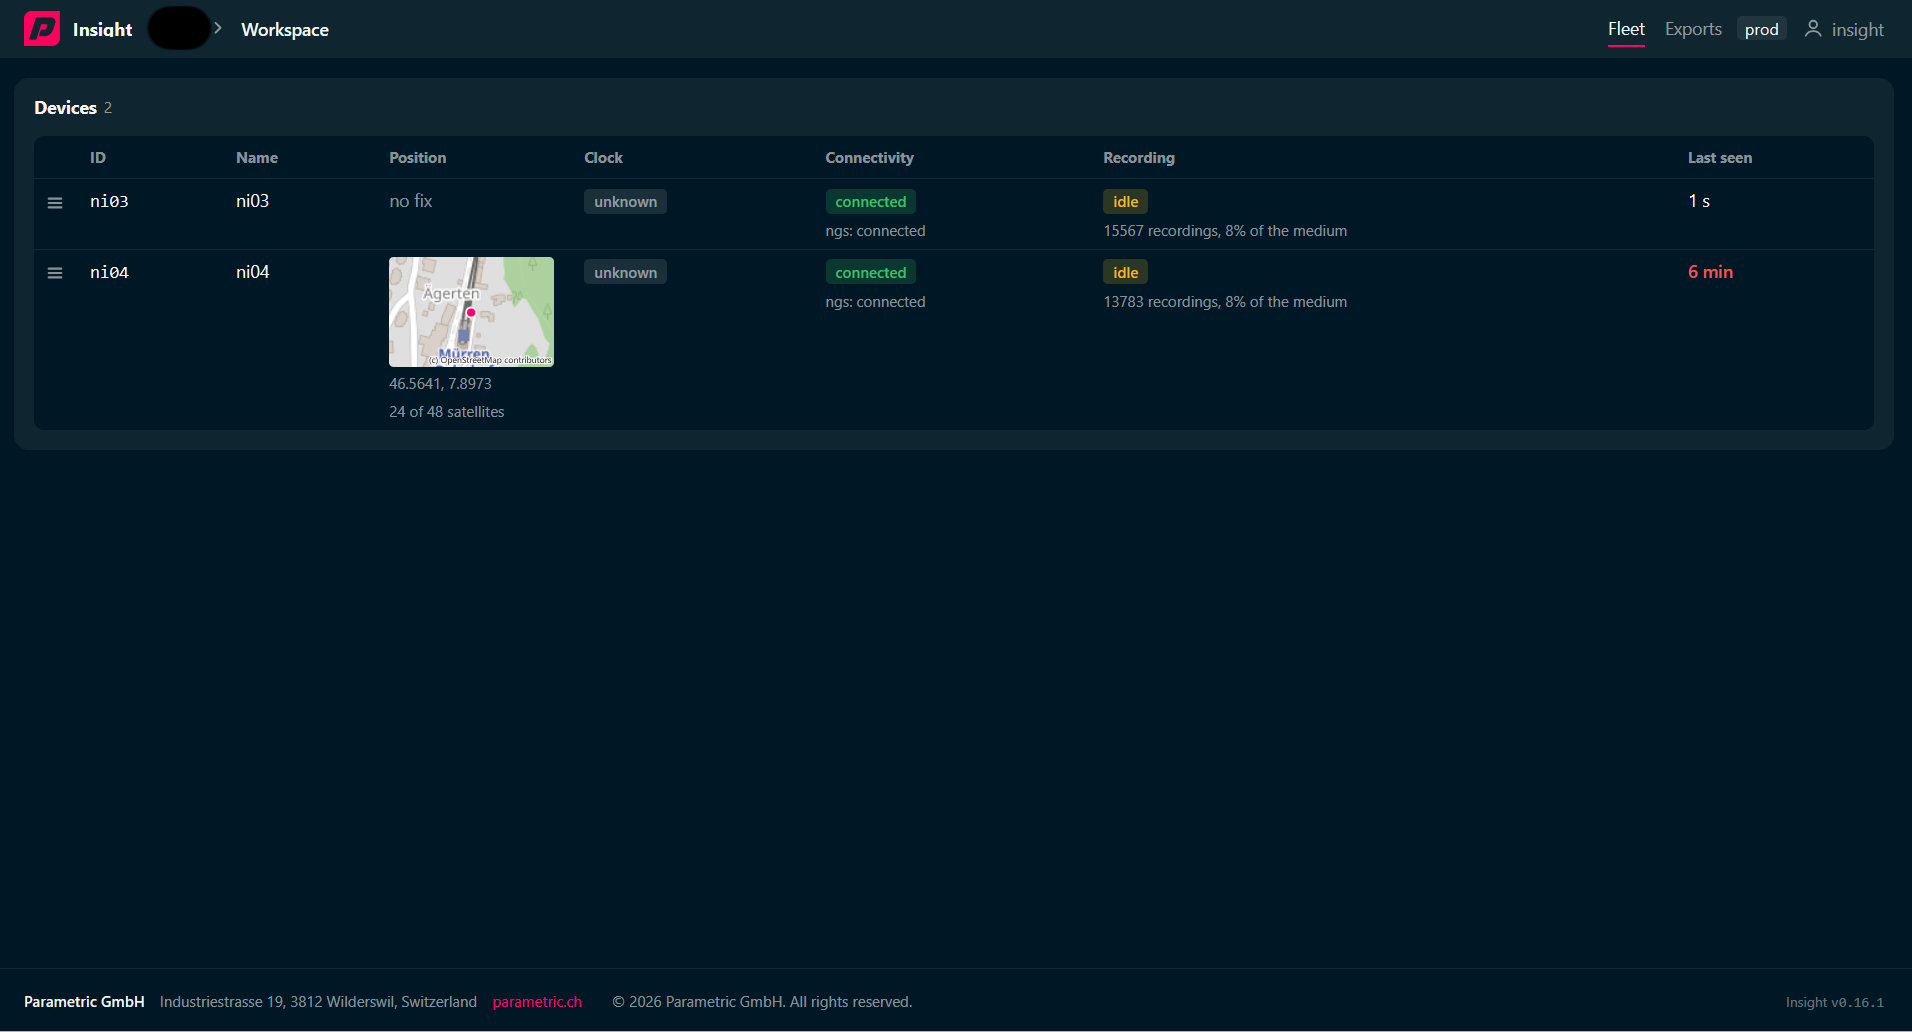
Save filters, activate daily email reports and export results. Track device status in the fleet view.
View measurement events as hotspots on the map and open individual measurements directly.
Display measurements in a table and sort them by measured values. Find, for example, the loudest events or measurements with particularly high humidity and open the details.
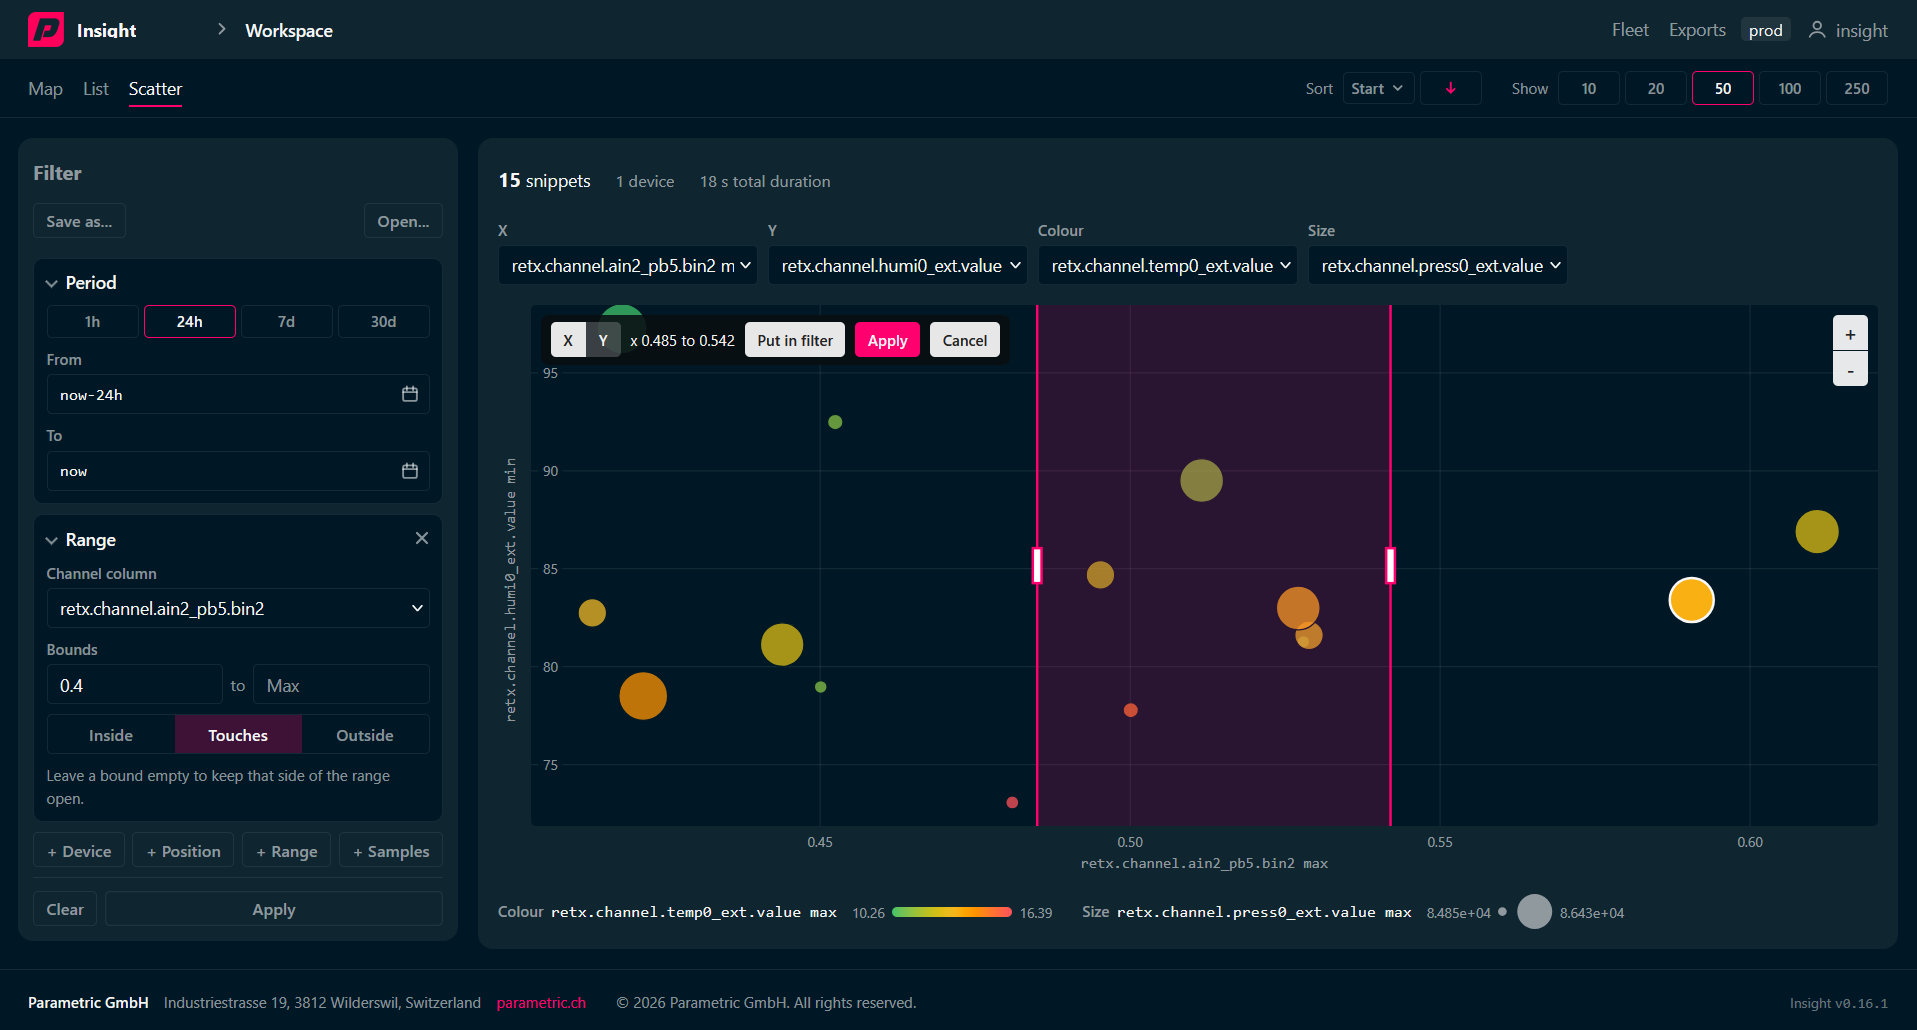
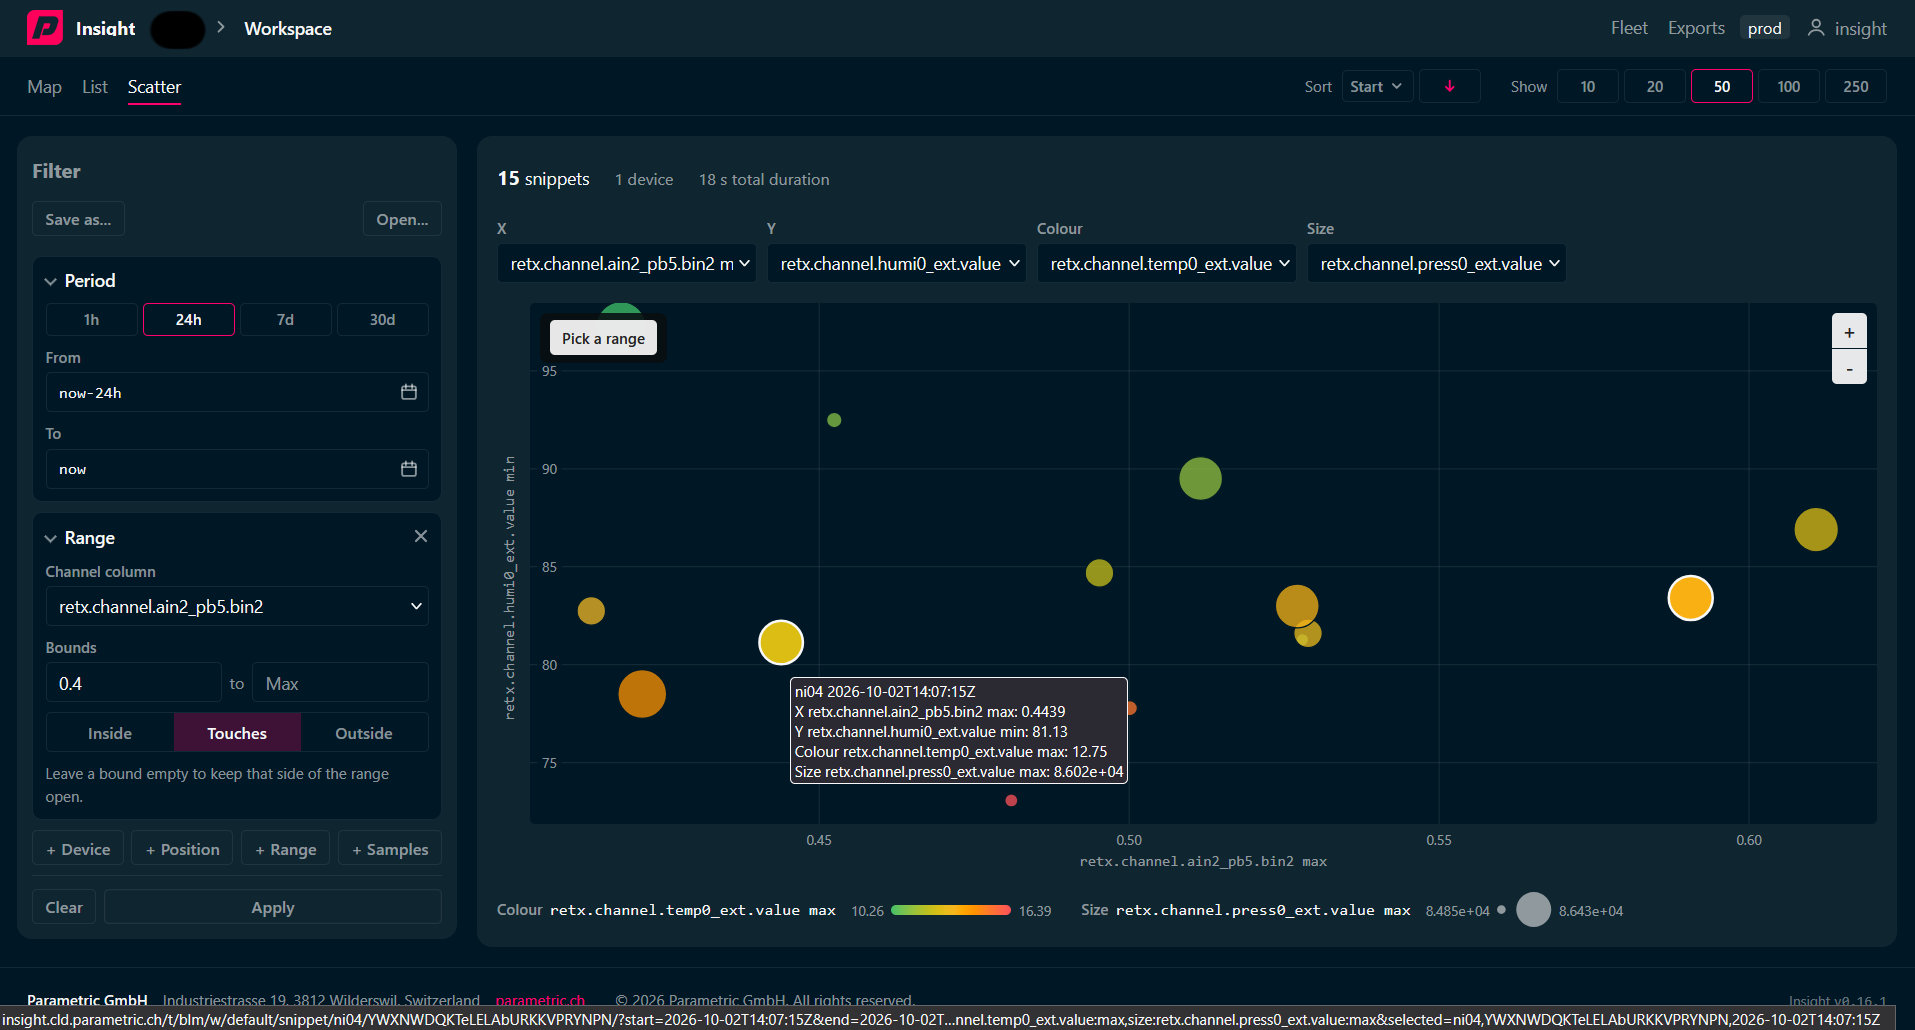
Plot measured quantities against each other in a scatter plot and visually narrow down areas of interest. The selection becomes a filter, and individual measurements can be examined directly.
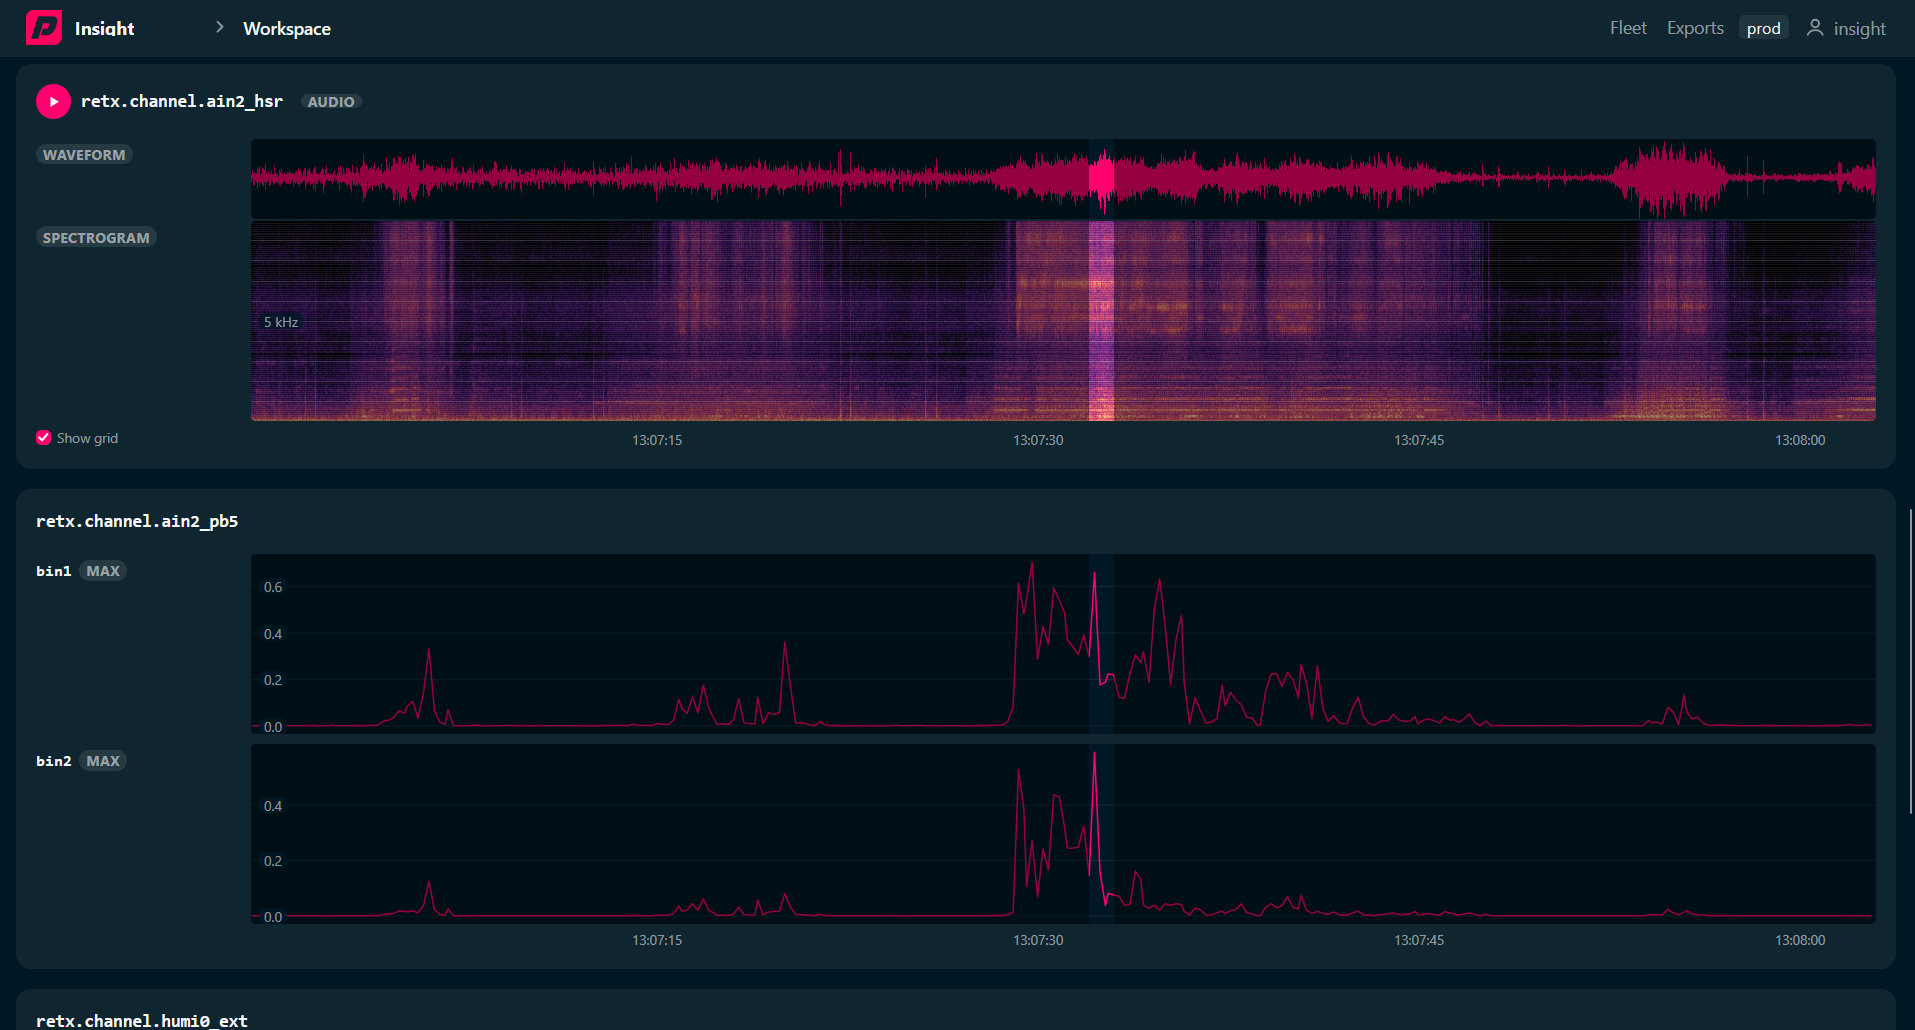
Examine individual data channels point by point. Listen to audio signals, identify frequencies of audio channels and vibration sensors and assign peaks to positions.
Context gives the measurement its meaning. Insight combines the data from your Parametric systems in a flexible analysis interface. Additional data channels can be added to suit your application.
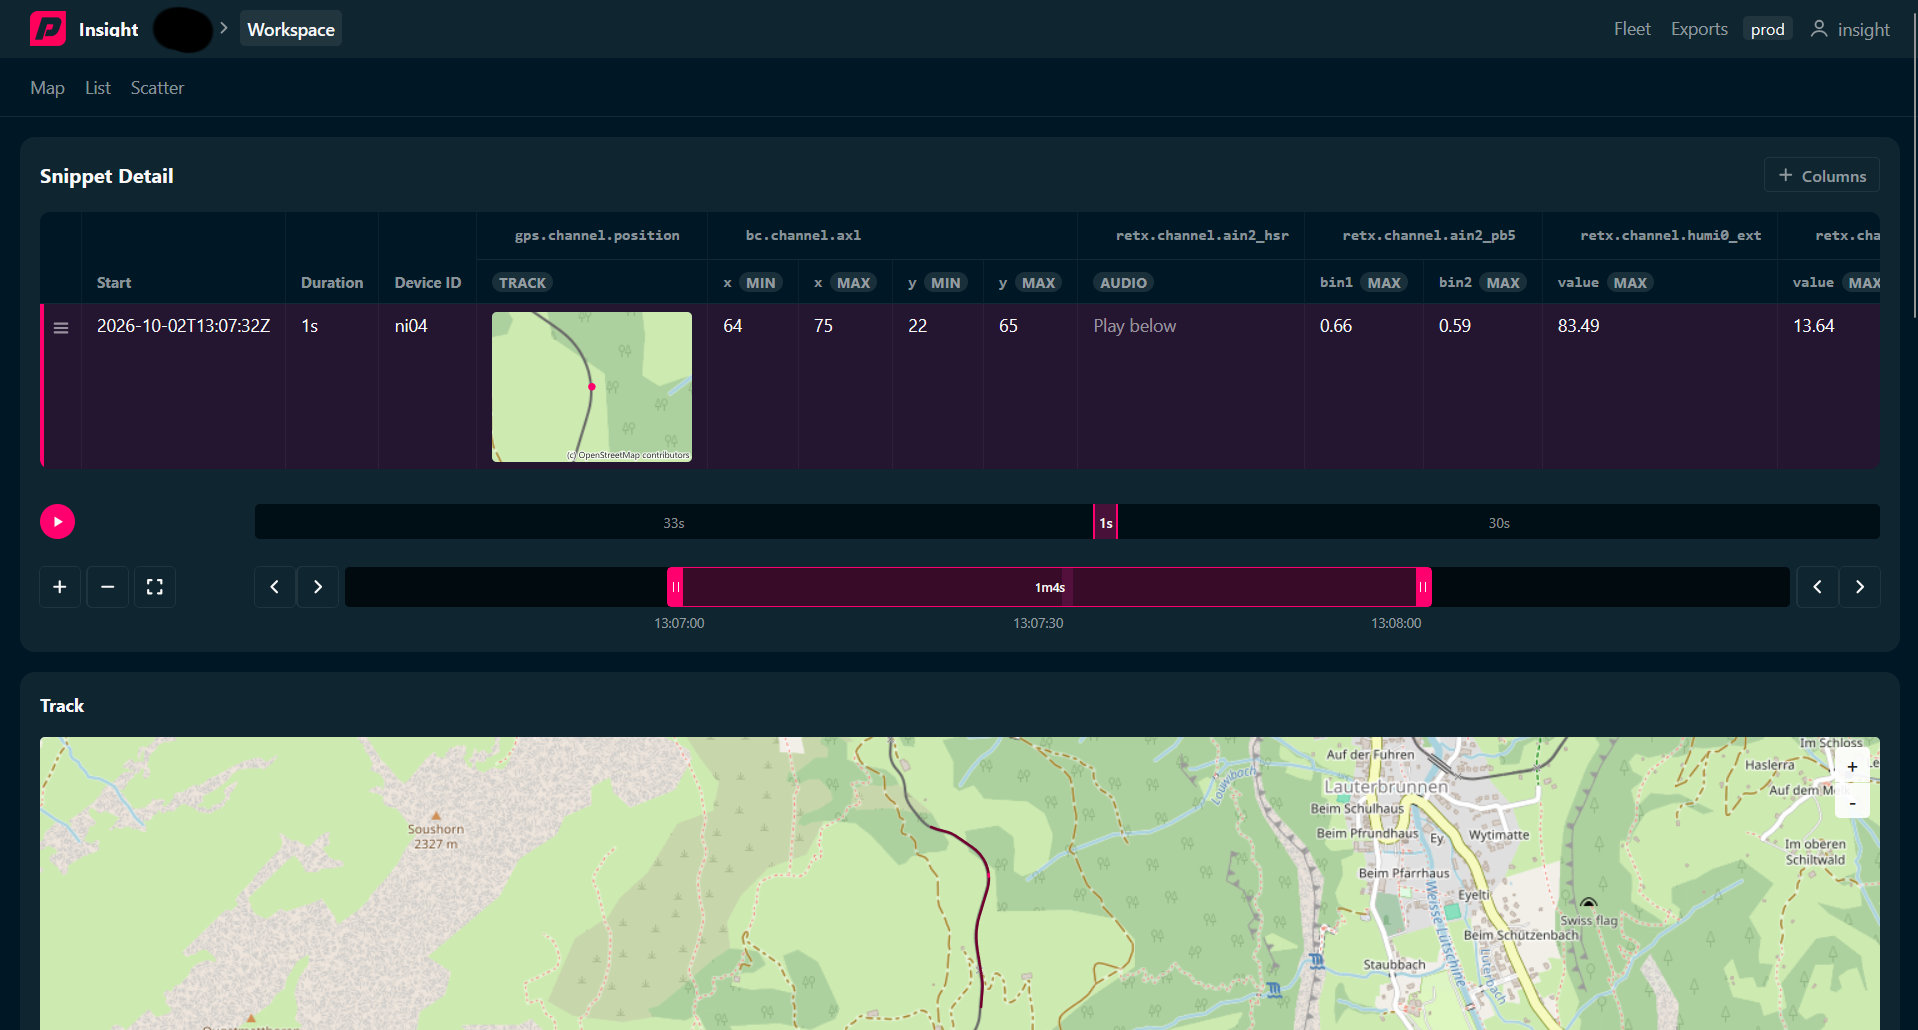
Examine individual measurements in detail and use the available raw data for further analysis.
Examine individual measurements in detail and use the available raw data for further analysis.
View statistical evaluations.
Define application-specific extensions together, including new questions outside rail operations, provided sensors and data connectivity fit.
Answer different questions as needed with the same measurement technology - completely flexible in operation.
Save the matching filters and activate reporting. Daily emails report new occurrences that match your criteria.
Keep an eye on the condition and current activity of your measurement devices.
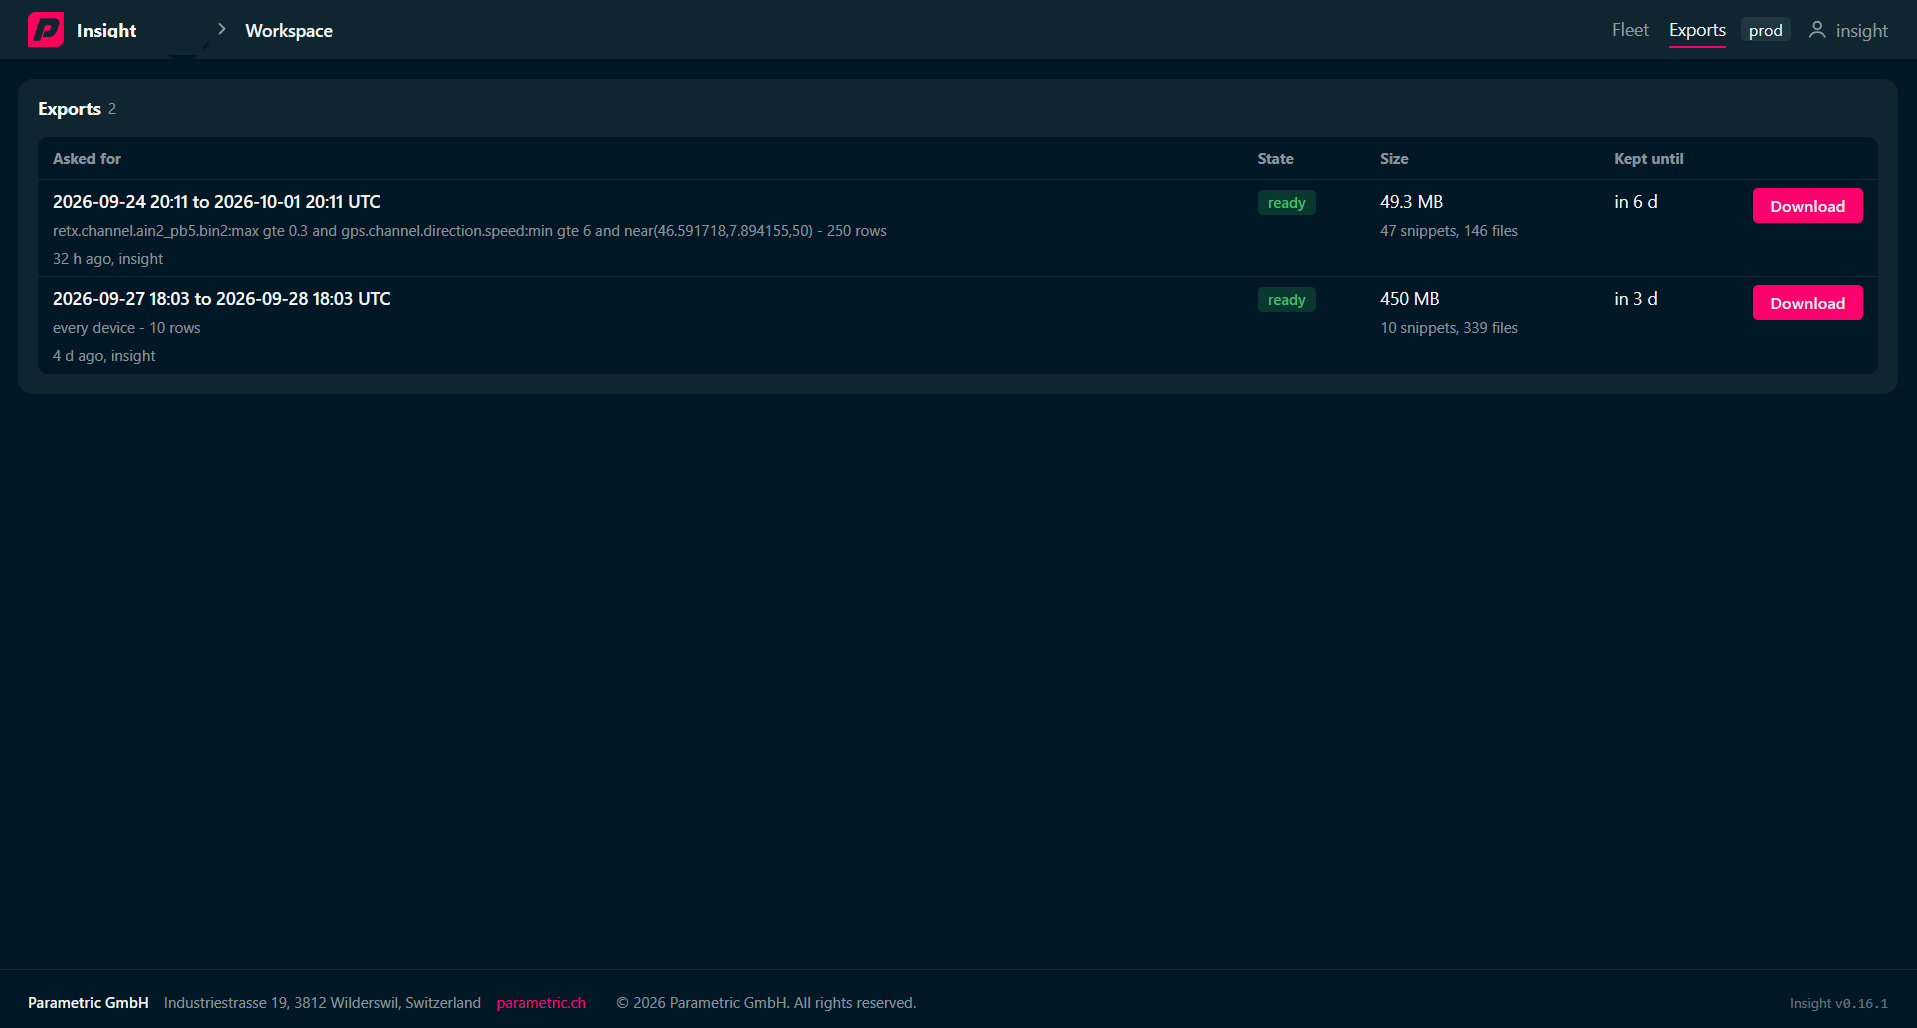
Export results and use selected raw data for in-depth analysis.
Talk to us about your question. We are happy to demonstrate possible approaches.