")
")
Parametric Cloud Analytics
Finding What Matters Through Rapid Correlation, Trend Analysis, and Continuous Monitoring,
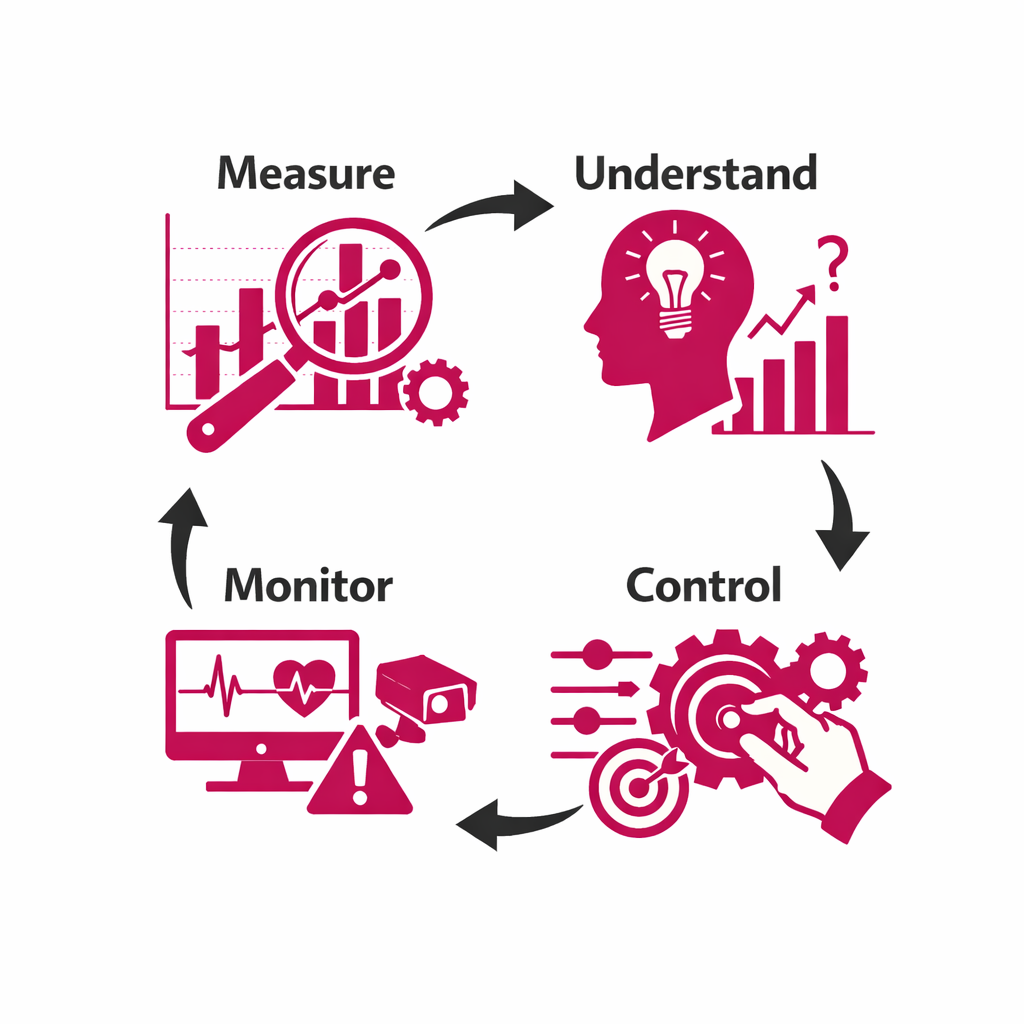
Physical reality is often complex. To make better decisions, it is important to understand the correlations, derive rules from them, and monitor their implementation.
Parametric Cloud Analytics is an integral part of Parametric's products, especially the Parametric Rail Efficiency Toolkit (RET). It is also used for monitoring and control tasks during operation. Specific patterns are identified in the cloud from data collected by on-board devices, such as noise, vibration, temperature, climate, position, or vehicle data. A simple web app provides operators with clear visual insights, from quick overviews to detailed drill-down analyses.
The Parametric Cloud Analytics environment offers application-specific modules, for example for noise monitoring, mechanical shock monitoring, or indications of increased abrasion.
During operation, the cleaned data and generated derived data can be made available to other systems via our API. There is also the option of intelligently controlling the digital outputs of Parametric devices in the field.
The RET analysis software makes complex data easy to understand and supports the workflow of learning, understanding, and monitoring.
With Parametric Cloud Analytics, you can:
- Identify problems early. Intelligent software searches the data for patterns and anomalies so that problems can be fixed before failures occur. Standard modules get you to your goal quickly.
- Listen and watch. Play back audio recordings and display them as easy-to-read waveforms and color-coded “fingerprints” to identify unusual noises.
- Set your own thresholds. Define what is too loud or too harsh and receive automatic alerts when these values are exceeded.
- Share or integrate. Export results or connect RET analysis software to existing systems via the open interface.
Why Choose RET Analysis Software?
- Integrated Platform – RET measurement technology can be used to gather knowledge, in parallel with control via RAILCTX devices or monitoring.
- Intelligent anomaly detection – Advanced algorithms detect patterns, anomalies, and causes to reveal emerging risks.
- Intuitive Web Interface – Listen to audio, view waveforms and frequency spectra, and examine diagnostic snippets in a user-friendly app.
- Easily expandable – Application-specific data can be easily imported and analyzed.
- Alerting and reporting – Receive automatic notifications when values are exceeded.
- Integration – Export results or connect the platform to your existing systems.
📩 Contact us today to learn more about our analysis and monitoring capabilities!